


Quick Answer:
To create a Power BI dashboard, import your dataset into Power BI Service, open a report, pin visualizations to a new dashboard, choose appropriate chart types, and publish your dashboard. This allows for real-time, interactive business insights.
What Is a Power BI Dashboard?
A Power BI dashboard is a one-page visual summary that displays key metrics using interactive visual tiles pinned from reports. Available only in Power BI Service, it enables real-time monitoring, supports multiple datasets, and provides cloud and on-premises data integration.
Perfect for: Decision-makers, analysts, and managers needing a consolidated view of KPIs.
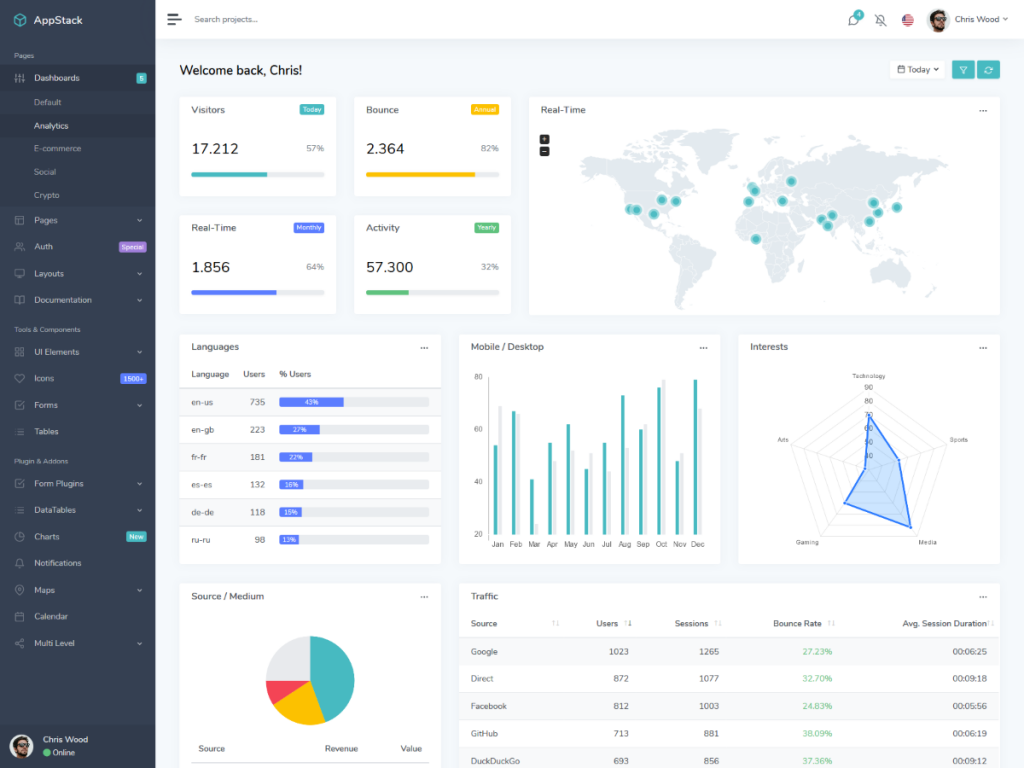
Image Source: https://docs.microsoft.com/en-us/power-bi/service-dashboards
Dashboards are a feature unique to Power BI service alone, and not available on Power Business Intelligence Desktops. Also, you can view and share your dashboards on mobile devices, but not create them on mobile.
Why Use Power BI Dashboards?
- Real-time updates from backend data
- Combines cloud + on-premise datasets
- Supports mobile viewing
- Interactive tiles with drill-down functionality
- Ideal for business monitoring and performance tracking
Related Solution: → Check out our Data Engineering Services to build automated data pipelines that feed into Power Business Intelligence dashboards seamlessly.
Step-by-Step Tutorial: How to Create a Power BI Dashboard
This guide explains how to create a Power Business Intelligence dashboard from scratch, using an Excel dataset, and pinning visualizations for business intelligence reporting.
Step 1: Import Your Excel Workbook
How to import Excel to Power BI Service:
- Go to app.powerbi.com
- Navigate to My Workspace > Get Data
- Click Files, locate your Excel workbook
- Select Import (not Upload)
- A report and dataset will be automatically created
Tip: Make sure your Excel sheet is formatted as a table for clean imports.
Step 2: Pin Tiles to the Dashboard
- Go to Reports > Select your report
- Switch to Edit mode
- Hover over a visual → Click Pin
- Choose New dashboard and name it
- Repeat to build your dashboard
You can pin visuals from multiple reports, creating a dashboard that spans multiple datasets.
Step 3: Choose the Right Charts
Choosing the correct chart is key to accuracy and storytelling. Use this table:
| Chart Type | Use For |
| Pie Chart | Composition (e.g., revenue split) |
| Bar/Column Chart | Comparison and distribution |
| Line Chart | Trends over time |
| Area Chart | Trend + volume |
| Stacked Chart | Comparison + composition |
| Scatter Plot | Relationships between variables |
Need help choosing charts or building reports? Check our Custom Software Development — we design smart analytics solutions with Power BI, Looker, and Tableau.
Step 4: Save and Publish
- Click Save
- Publish to Power BI Service
- Share your dashboard with your team
FAQs (Frequently Asked Questions)
Q1. Can I build dashboards in Power BI Desktop?
A1. No, dashboards are exclusive to Power BI Service, not available on Power BI Desktop.
Q2. How do I share a Power BI dashboard?
A2. After publishing, use the Share button in Power BI Service to send it to team members via email or workspace access.
Q3. What kind of data can Power BI dashboards use?
A3. Power BI supports data from:
- Excel
- SQL Server
- Google Analytics
- Azure
- Salesforce
- Web APIs
Next Steps
Congratulations! You’ve just built your first Power BI dashboard. This tool is not only powerful but also intuitive when combined with the right strategy.
Ready to go beyond the basics?
- Ready to lead with data? Join our Data Strategy Workshop
- Explore AI-Powered Dashboards for smarter insights
- Book a free consultation to automate your reporting pipeline
- Want deeper insights and more powerful dashboards? Our Data Strategy Workshop is designed to help you unlock the full potential of Power BI
TL;DR Summary
- Power BI dashboards are one-page visual summaries
- Created by importing datasets and pinning visuals
- Use correct charts to enhance understanding
- Publish dashboards for real-time sharing
- Great for executives, analysts, and business teams
Related Services:
You can download the document here: PowerBI_Dashboard_Guide_Optimized.docx.